Forecast Settings

From the Options menu, select Settings

The Forecast Settings Dialog displays the simulation settings for the forecast currently displayed. No part of the dialog is editable, however the controls are the same as setting up the simulation.

Usage

The Forecast Settings sheets provide the detailed settings made to tailor a simulation. Understanding these settings can guide future simulations; for example, should more runs be completed to improve statistical accuracy of the forecast. The settings may explain unexpected forecast results, particularly if Critical Path Method was used on a model with complex dependencies. The settings will also show if trends were created.

Features

Forecast Settings Sheet

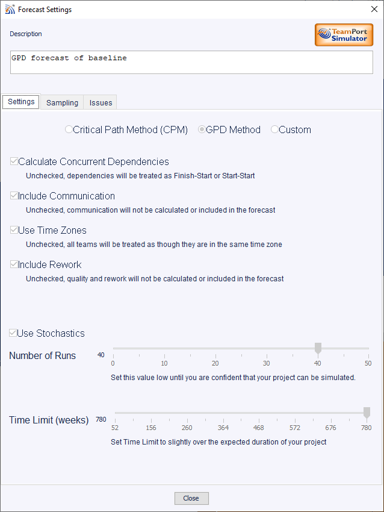
CPM Method: is similar to how project schedulers such as MS Project calculate a project schedule.

GPD Method: includes the four options listed below it, providing you with the most accurate project forecast.

Custom Method: shows you how the project was simulated:

If concurrent dependencies was selected the simulator calculated work and communication effort following the characteristics that you configured in each dependency. Excluded, all dependencies will have been treated as finish-start, start-start, and finish-finish relationships.

If communication was selected the simulator calculated the time and cost associated with communication and included it in the forecast.

If time zones was selected the simulator calculated communication between teams based on their location settings. Not selected, the simulator assumed a single time zone for all teams.

If rework was selected the simulator added rework to the project.

If Use Stochastics was selected, the simulator varied the actual amount of time spent performing work or communication.

Number of Runs displays the total number of simulation runs selected

Time Limit displays the total number of weeks set for the sumulation run.
Forecast Sampling Sheet

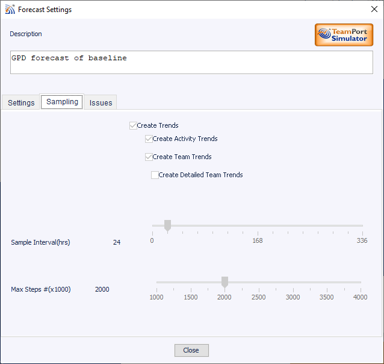
Trends Settings will determine whether trends have been created.

Sample Interval (hrs) shows the interval time used in simulation.

Max Steps # shows the maximum number of steps allowed for simulation. All simulation runs completed in less than this maximum.

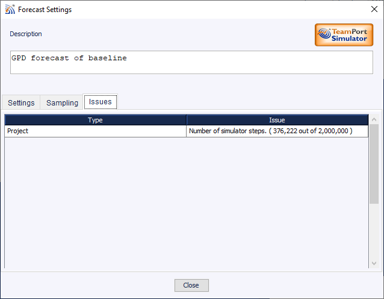
Forecast Issues Sheet

Issues will vary depending on the simulation settings and the nature of the project. Issues presented are informational - critical issues will cause the project not to simulate at all.